
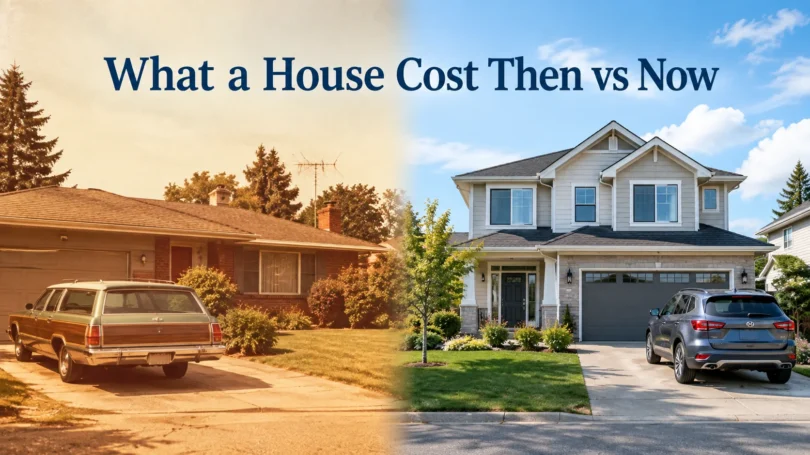

If you bought your first home in the 1970s or 1980s, you have probably told someone younger what you paid for it and watched their jaw drop. The numbers sound tiny today. But inflation, incomes, mortgage rates and the size of homes have all changed, so the raw prices only tell part of the story.
This guide lays out what homes cost in each decade, adjusts those prices to today’s dollars, and compares what a typical mortgage payment took out of a household’s income then and now.
Median home values by decade
The Census Bureau asked homeowners to estimate the value of their homes in every census from 1940 to 2000. These are the median values for owner-occupied homes nationwide.
| Census year | Median home value (then) | In 2026 dollars (approximate) |
| 1940 | $2,938 | about $69,500 |
| 1950 | $7,354 | about $101,100 |
| 1960 | $11,900 | about $133,200 |
| 1970 | $17,000 | about $145,200 |
| 1980 | $47,200 | about $189,800 |
| 1990 | $79,100 | about $200,600 |
| 2000 | $119,600 | about $230,200 |
Sources: U.S. Census Bureau, Historical Census of Housing Tables, median home values. 2026-dollar figures are our calculation using the Consumer Price Index and are rounded.
For a more recent comparison, the median sales price of a newly built home in the United States was $410,700 in the second quarter of 2026, according to the Census Bureau and HUD. New homes usually cost more than the typical existing home, but the gap from 2000 is still striking.
Even after adjusting for inflation, homes were worth about twice as much in 2000 as in 1950, and prices have climbed sharply again since. The Census Bureau noted that median values grew fastest in the 1970s, by about 43% after inflation, and slowest in the 1980s.
Why you see different numbers for the same year
Search “average house price 1980” and you will find answers from about $47,000 to $76,000. They are all measuring different things:
- Median value of all owner-occupied homes (Census, $47,200 in 1980): what homeowners said their existing homes were worth.
- Median sales price of new homes (Census and HUD, about $64,600 in 1980): only brand-new houses, which tend to be larger and more expensive.
- Average sales price: an average is pulled up by expensive homes, so it is higher than the median.
When you compare then and now, compare the same measure across years.
Homes are also bigger
Part of the price difference is size. The median new single-family home built in 1980 was about 1,595 square feet. By late 2024, it was about 2,205 square feet, roughly 38% larger. Today’s homes also usually have more bathrooms, central air, larger garages and modern kitchens. A fairer comparison looks at price per square foot, which has still risen faster than inflation, but by less than the headline prices suggest.
What the mortgage cost then vs now
Prices are only half the story. Mortgage rates have swung dramatically.
| 1980 | 2026 | |
| Typical new home price | $64,600 | $410,700 |
| 30-year mortgage rate | about 13.7% (yearly average) | 7.03% (Freddie Mac, September 24, 2026) |
| Down payment assumed | 28% | 10% |
| Monthly principal and interest | about $542 | about $2,467 |
| Share of median household monthly income | about 40% | about 35% |
Sources: 1980 figures from Landmark Wealth Management’s analysis of Census and Freddie Mac data; 2026 payment is our calculation at 7.03% with 10% down, compared with 2024 median household income of $83,730 from the Census Bureau.
By this measure, a new home in 1980 actually took a bigger share of income each month, because mortgage rates were so high. Rates peaked above 18% in October 1981. What made the 1980s more affordable for many buyers was that prices were much lower relative to incomes, so saving a down payment was easier, and later refinancing at lower rates cut payments sharply.
House prices compared with income
MoneyGeek’s analysis of Census data found that the ratio of home prices to household income nearly doubled, from about 2.5 in 1980 to about 4.4 in 2023. In plain terms, a typical home cost two and a half years of income in 1980 and more than four years of income recently. That is the main reason saving a down payment feels so much harder for younger buyers today.
It also explains why the typical first-time buyer is older today than in 1981, when most first-time buyers were in their late 20s or early 30s.
Why home prices rose so much faster than other prices
Economists point to several causes, and most of them built up over decades:
- Not enough homes were built. After the 2008 housing crash, builders slowed down sharply, and construction did not catch up with population and household growth for years.
- Land and building costs rose. Lumber, labor, permits and land near jobs have all become more expensive, especially in growing metro areas.
- Local rules limit what can be built. Zoning that allows only large single-family lots in many areas restricts the supply of smaller, cheaper homes.
- Cheap money pushed prices up. Very low mortgage rates, especially in 2020 and 2021 when the 30-year rate fell below 3%, let buyers bid more for the same house.
- Owners are staying put. Many homeowners locked in low rates and are reluctant to sell, which keeps fewer existing homes on the market.
Some of these pressures ease over time, but together they explain why a home now costs so many more years of income than it did for earlier generations.
What this means for people 40 and older
If you bought decades ago, you probably have substantial home equity. For many households, the home is the largest asset they own. That equity can support retirement through downsizing, a move to a lower-cost area, or in some cases a reverse mortgage. Each option has trade-offs worth weighing carefully.
Your property tax may be based on a much higher value than you paid. Senior exemptions and assessment freezes can help, but you usually have to apply.
Your insurance should reflect today’s rebuilding costs, not what you paid. Underinsurance is common among long-time owners.
If you are helping adult children buy, understand why it is harder: prices are higher relative to incomes, even if monthly payments as a share of income are not far from 1980 levels.
Selling a home you bought long ago
If you sell a home you have owned for decades, check the tax rules. Married couples can generally exclude up to $500,000 of gain from income on the sale of a primary home, and single filers up to $250,000, if they owned and lived in it for at least two of the last five years. Gains above that are taxed, and a large sale can also raise Medicare premiums two years later. Keep records of improvements, since they add to your cost basis and reduce the taxable gain.
Frequently asked questions
What was the average house price in 1980? The median value of owner-occupied homes was $47,200 in the 1980 census. The median price of a new home sold that year was about $64,600.
How much was a house in 1970? The median home value in the 1970 census was $17,000, or roughly $145,000 in 2026 dollars.
Were houses more affordable in the 1980s? Prices were lower relative to income, which made down payments easier to save. Monthly payments, however, often took a larger share of income because mortgage rates were very high.
What is the median price of a new home in 2026? $410,700 in the second quarter of 2026, according to the Census Bureau and HUD.
Sources
- U.S. Census Bureau, Historical Census of Housing Tables: Home Values (1940 to 2000)
- U.S. Census Bureau and HUD, Median Sales Price of Houses Sold, Q2 2026 (via FRED)
- Freddie Mac, Primary Mortgage Market Survey (September 24, 2026)
- U.S. Census Bureau, Income in the United States: 2024
- Landmark Wealth Management, “The Affordability of Homeownership: Then vs Now” (November 2025)
- MoneyGeek, “Who Had It Worse? Homebuyers in the 80s vs. Today” (2026)
- Meredith Wealth Management, “Is Housing More Expensive Today Than in 1980?” (August 2025), for home size data
Historical figures are national medians and rounded. This article is general information, not financial or tax advice.